Hybrid vs Gasoline Savings Calculator. How to Work Out Exactly When a Hybrid Pays for Itself
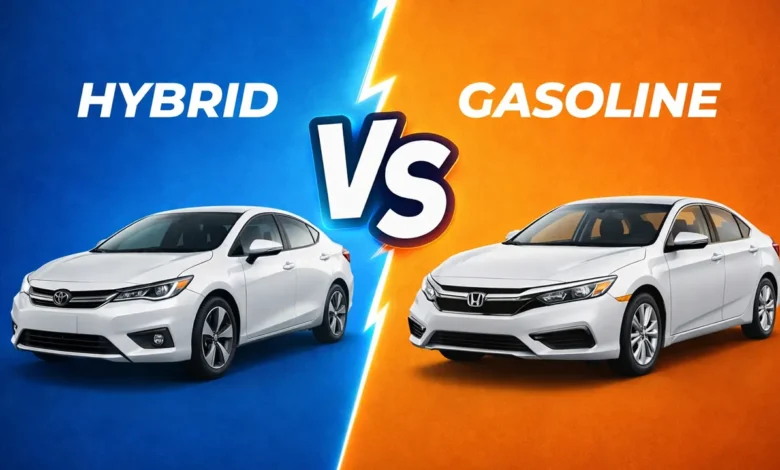
Hybrid vs Gasoline Savings Calculator: The question that follows almost every conversation about buying a hybrid car in the United States is some version of the same financial calculation: how long does it actually take for the fuel savings to offset the higher purchase price? It is a question that sounds simple and is, in practice, considerably more nuanced than most dealership conversations acknowledge — because the answer depends on six independent variables whose interaction produces dramatically different outcomes for different drivers in different circumstances. The high-mileage urban commuter who fills a tank three times a week and drives primarily in stop-and-go city traffic will reach their break-even point in three years or less. The low-mileage weekend driver who averages 8,000 miles annually on predominantly highway routes may never recover the hybrid premium in any financially meaningful timeframe. This guide explains exactly how to build your own hybrid versus gasoline savings calculation, what inputs matter most, what results to expect from real-world 2026 vehicle comparisons and what the calculation misses that is equally important to the financial decision.
Understanding the Break-Even Calculation: The Formula That Drives Every Comparison
The foundation of every hybrid versus gasoline savings comparison is a break-even calculation whose mathematics are straightforward but whose inputs require careful sourcing from real-world data rather than optimistic assumptions. The formula works as follows: divide the price premium of the hybrid above its gasoline equivalent by the annual fuel cost savings that the hybrid’s superior fuel economy delivers, and the result is the number of years required for the hybrid to pay for itself through reduced fuel expenditure. Expressed as an equation:
Break-Even Point (years) = Hybrid Price Premium ÷ Annual Fuel Savings
Where: Annual Fuel Cost = (Annual Miles ÷ MPG) × Fuel Price Per Gallon Annual Fuel Savings = Gas Car Annual Fuel Cost − Hybrid Annual Fuel Cost
The inputs that determine whether the calculation works in the hybrid buyer’s favour are the price premium, the MPG gap between the gasoline and hybrid models, the annual mileage and the fuel price per gallon. Each of these deserves individual attention because small changes in any one of them produce disproportionately large effects on the break-even outcome.
Input One: The Hybrid Price Premium
The price gap between a hybrid vehicle and its closest gasoline-powered equivalent from the same manufacturer has narrowed considerably in recent years as hybrid system costs have fallen and production volumes have scaled — but a premium still exists in virtually every comparison. According to data from Kelley Blue Book’s 2026 hybrid versus gasoline analysis, the premium for a hybrid version of a mainstream vehicle typically ranges from approximately $1,375 at the lower end — as illustrated by the Toyota Corolla Hybrid costing $1,375 more than the standard Corolla LE — to $4,000 or above for larger vehicles where the hybrid powertrain represents a more significant engineering addition. The premium for compact and midsize car hybrids generally falls between $1,500 and $3,000, while hybrid SUVs and crossovers typically carry premiums of $2,000 to $5,000.
The practical implication for the break-even calculation is significant: a smaller premium requires fewer years of fuel savings to recover, and the hybrid’s financial case strengthens accordingly. The buyer choosing between the Toyota Corolla and the Corolla Hybrid faces a $1,375 decision. The buyer choosing between a gasoline compact SUV at $28,000 and a hybrid version at $32,000 faces a $4,000 recovery challenge that demands proportionally more annual driving or higher fuel prices to justify within a reasonable ownership period.
Input Two: The MPG Gap — The Most Powerful Variable in the Calculation
The difference in fuel economy between the gasoline and hybrid versions of the same vehicle is the single most powerful driver of the annual savings figure — and the range of that difference across the 2026 model year’s most popular vehicles is wider than most buyers realise. At the lower end of the efficiency gain spectrum, vehicles like the Hyundai Tucson move from approximately 27 miles per gallon in gasoline specification to 38 miles per gallon in hybrid form — a gain of 11 miles per gallon, or roughly 41 percent improvement. At the upper end, the Toyota Camry’s transition from a 32 miles per gallon gasoline specification to 51 miles per gallon as a hybrid represents a 59 percent improvement — the largest efficiency gain in the midsize sedan segment and a direct consequence of Toyota’s decision to make the 2026 Camry exclusively hybrid-powered.
The practical calculation of this MPG gap’s financial value at national average fuel prices of $3.32 per gallon and 15,000 annual miles illustrates the range of outcomes available. The Corolla’s 16 miles per gallon gap between its gasoline specification at 34 MPG and hybrid specification at 50 MPG produces annual fuel savings of approximately $459 — enough to recover the $1,375 price premium in approximately three years. The Camry’s 19 MPG gap, applied to the same annual mileage and fuel price, produces annual fuel savings significantly exceeding $600 — a more compelling case for the hybrid that is further reinforced by the absence of a gasoline Camry in the 2026 lineup, making the comparison one of hybrid versus a competitor’s gasoline model rather than hybrid versus the same nameplate.
Input Three: Annual Mileage — The Factor That Changes Everything
The annual mileage variable is where the hybrid versus gasoline savings calculation most dramatically diverges between different types of buyers — because fuel savings scale linearly with miles driven while the price premium is a fixed one-time cost. A buyer who drives 20,000 miles per year reaches their break-even point at approximately two-thirds the time of a buyer who drives 12,000 miles per year, and realises proportionally greater lifetime savings across the same ownership period.
Consider the practical illustration using a compact SUV comparison: a gasoline model at 27 MPG and a hybrid at 38 MPG, with the hybrid costing $2,500 more. At the national average fuel price of $3.32 per gallon, the 12,000-mile annual driver saves approximately $323 per year in fuel — reaching break-even in 7.7 years. The 20,000-mile annual driver saves approximately $538 per year — reaching break-even in 4.6 years. At 25,000 miles annually — common among sales representatives, contractors and others whose occupation involves substantial daily driving — the same calculation reaches break-even in 3.7 years, with meaningful cumulative savings thereafter across the ownership period. The United States Federal Highway Administration identifies the average American as driving approximately 13,500 miles per year — a figure that positions the typical buyer toward the middle of this spectrum, generally reaching break-even within four to six years on most hybrid premiums at current fuel prices.
Input Four: Fuel Price — The Volatile Variable That Shifts the Calculation
Fuel price is the most volatile of the four core inputs and the one over which the buyer has least control — but it is also the input whose directional movement most consistently favours the hybrid’s financial case over the medium to long term. At the national average price of $3.32 per gallon that Kelley Blue Book identified for early 2026, a 50 MPG hybrid driven 15,000 miles annually costs $975 per year to fuel. The equivalent 34 MPG gasoline vehicle costs $1,434 per year — a difference of $459 per year.
A fuel price increase from $3.32 to $4.00 per gallon — a move that American drivers have experienced multiple times in the past decade — changes the hybrid’s annual fuel cost to $1,176 against the gasoline vehicle’s $1,729, widening the annual saving to $553 and accelerating the break-even calculation by several months. At $4.50 per gallon — the approximate national average reached in the summer of 2022 — the same comparison produces annual savings of $622, further compressing the break-even timeline. The directional implication is consistent: rising fuel prices accelerate the hybrid’s financial case without requiring any change to the buyer’s mileage or the vehicles’ respective MPG figures, which is why buyers who are weighing a long-term ownership decision should conduct their break-even calculation at multiple fuel price scenarios rather than anchoring exclusively on the current pump price.
Read: EV Charging Cost Per Month in the USA. A Complete Comparison
Real-World 2026 Comparison: The Step-by-Step Calculator in Action
Applying the framework to four of the most popular 2026 hybrid versus gasoline comparisons illustrates the range of outcomes that different vehicles and different driving patterns produce.
Toyota Corolla vs Corolla Hybrid — The Compact Economy Sedan Case Price Premium: $1,375 | MPG: 34 (gas) vs 50 (hybrid) | Savings at 15,000 miles / $3.32 gas: $459/year | Break-Even: 3.0 years
Toyota RAV4 Hybrid vs Equivalent Gasoline Compact SUV — The Compact SUV Case Price Premium: ~$3,500 | MPG: 27 (gas) vs 44 (hybrid) | Savings at 15,000 miles / $3.32 gas: ~$538/year | Break-Even: ~6.5 years
Toyota Camry Hybrid vs Honda Accord (Gasoline) — The Midsize Sedan Case Price Premium: ~$2,000 | MPG: 32 (gas) vs 51 (hybrid) | Savings at 15,000 miles / $3.32 gas: ~$614/year | Break-Even: ~3.3 years
Hyundai Tucson Hybrid vs Tucson Gasoline — The Mid-Size SUV Case Price Premium: ~$2,500 | MPG: 27 (gas) vs 38 (hybrid) | Savings at 15,000 miles / $3.32 gas: ~$323/year | Break-Even: ~7.7 years
What the Fuel Savings Calculator Does Not Tell You
Every hybrid versus gasoline savings calculator built around fuel costs alone produces an incomplete picture of the true financial comparison between the two powertrain types — because fuel is only one of the categories where hybrid and gasoline vehicles differ in their long-term cost profiles, and in some categories the hybrid’s advantage extends well beyond the fuel savings that the break-even calculation captures.
Maintenance costs favour hybrids systematically and meaningfully. The regenerative braking system that characterises every hybrid powertrain redirects kinetic energy into battery charge rather than heat through the friction brakes — a process that extends brake pad and rotor service life by a factor of two to three relative to conventional braking systems. The absence of traditional starter motor and alternator loads on the hybrid’s petrol engine, which the electric motor handles, reduces belt and accessory wear. The result is a maintenance cost advantage that Consumer Reports and multiple independent analyses consistently identify as meaningful — typically $200 to $400 per year less than equivalent gasoline vehicle maintenance expenditure across the ownership period.
Resale value compounds the hybrid’s financial advantage for buyers who intend to sell or trade within the ownership period. Hybrid vehicles historically demonstrate lower depreciation rates than equivalent gasoline models, particularly in periods of elevated fuel prices when used-market demand for fuel-efficient vehicles strengthens. For the buyer financing through a five-year loan with a trade-in at the end of that period, the hybrid’s superior residual value provides an additional financial benefit that does not appear in the fuel savings calculation but can represent $1,000 to $3,000 of additional value at trade-in depending on the model.
What does not favour the hybrid is insurance — hybrid vehicles typically carry slightly higher premiums than equivalent gasoline models due to their greater complexity and replacement part cost — and for some larger, less frequently driven vehicles, the longer break-even timeline may exceed the buyer’s realistic ownership period.
Read: EV vs Hybrid Cost of Ownership In USA. Financial Comparison Must Make Before Choosing a Powertrain
Your Personal Hybrid Savings Calculation: A Framework
To build your own hybrid versus gasoline savings calculation, gather the following four inputs for each vehicle you are comparing and apply the formula:
| Input | Where to Find It |
| Hybrid purchase price | Manufacturer website or dealer quote |
| Gasoline equivalent purchase price | Same source |
| Hybrid MPG (combined) | EPA FuelEconomy.gov |
| Gasoline model MPG (combined) | EPA FuelEconomy.gov |
| Your annual mileage | Your odometer history |
| Current local fuel price | GasBuddy or AAA state averages |
Step 1: Calculate annual gasoline model fuel cost = (Annual Miles ÷ Gas MPG) × Fuel Price Step 2: Calculate annual hybrid fuel cost = (Annual Miles ÷ Hybrid MPG) × Fuel Price Step 3: Annual Fuel Savings = Step 1 result minus Step 2 result Step 4: Price Premium = Hybrid Price minus Gas Price Step 5: Break-Even (years) = Step 4 result divided by Step 3 result
If the break-even point falls within your expected ownership period — and if you add the maintenance savings and resale value advantage that the fuel calculation omits — the hybrid’s total financial case is stronger than the break-even year alone suggests. For the majority of American drivers at 2026 fuel prices and typical driving patterns, the calculation does precisely that.